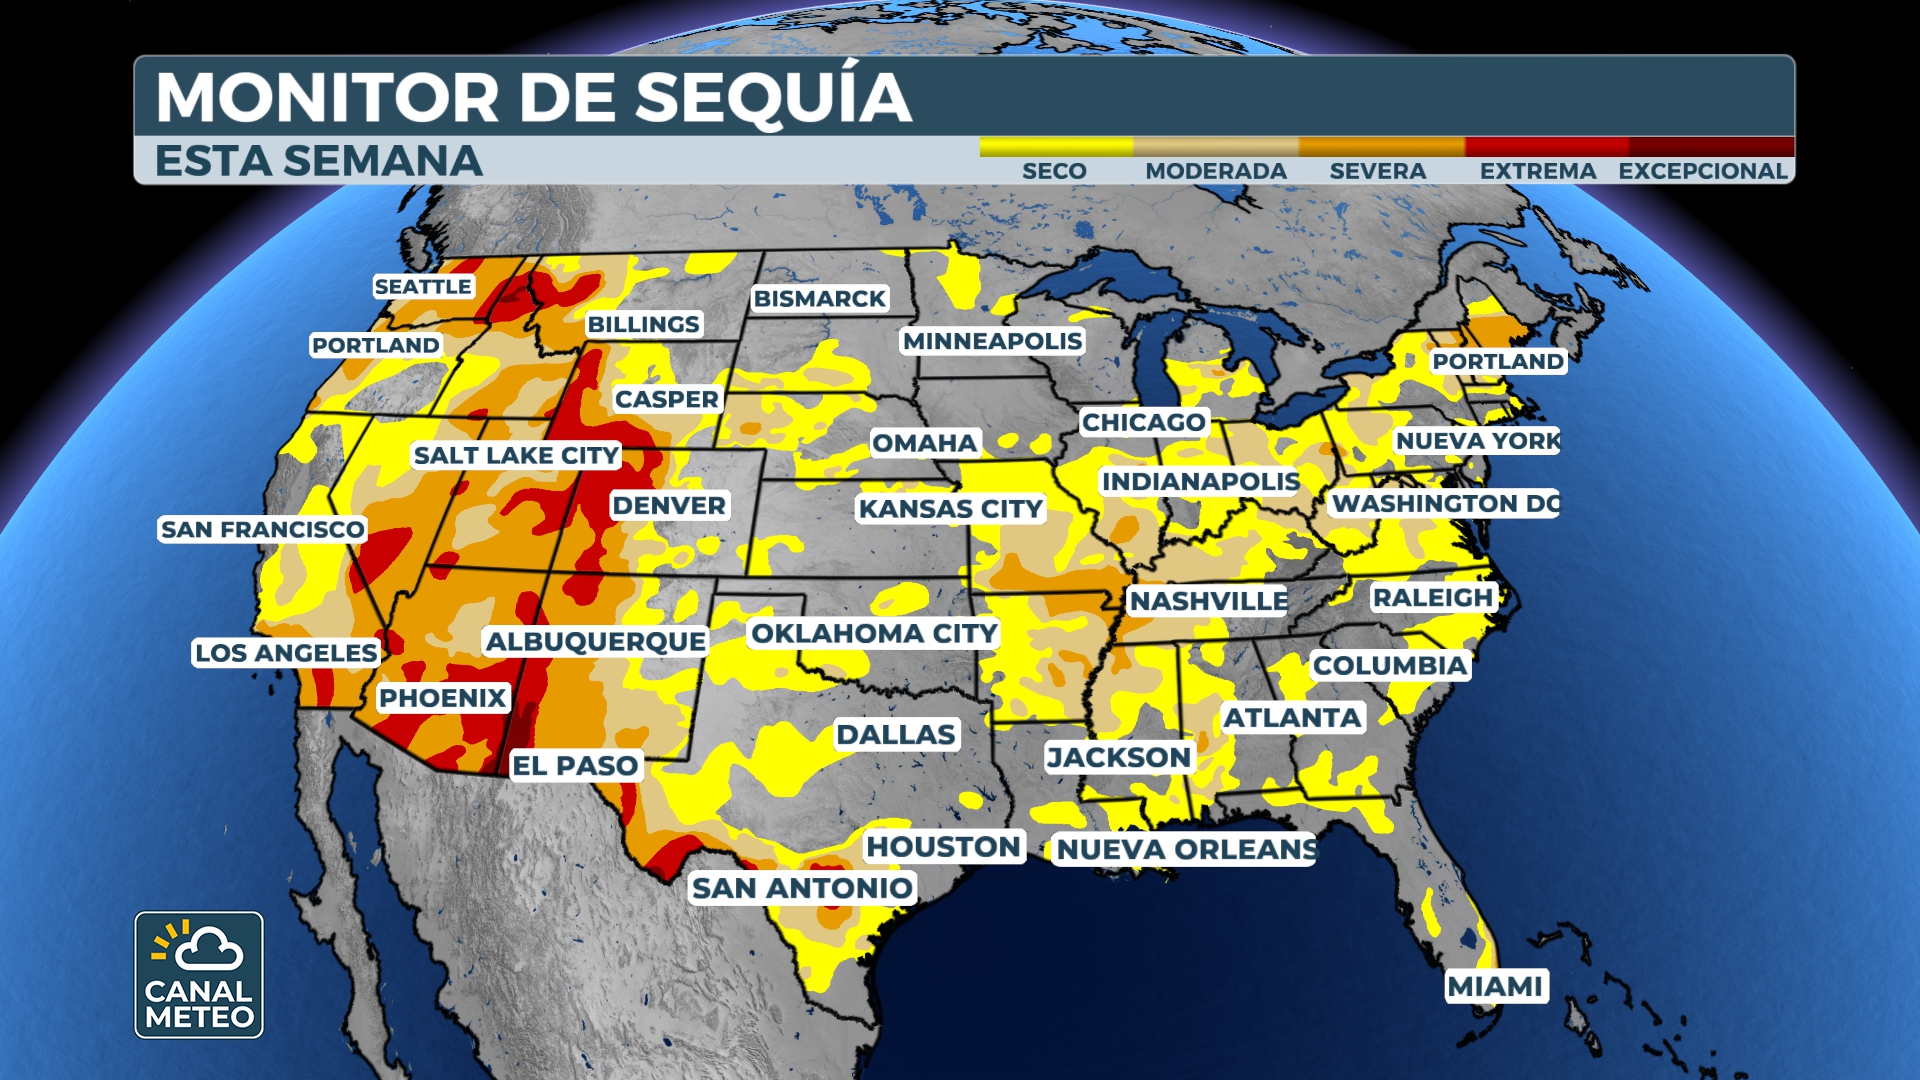
The U.S. Drought Monitor map. is updated weekly and combines weather, satellite, soil moisture and local reports. Climatology and agricultural experts analyze these sources to classify conditions into five levels, from "abnormally dry" to "exceptional drought." Although based on scientific data, it also incorporates field observations, making it a hybrid tool of science and community experience.
Category
Name
Color
Description
D0
Abnormally dry
Yellow
Drier than normal conditions; possible onset of drought or recovery from a previous drought.
D1
Moderate drought
Beige
Crop and pasture stress; some water deficits.
D2
Severe drought
Orange
Widespread crop damage; water restrictions possible.
D3
Extreme drought
Dark red
Major agricultural losses; common water shortages.
D4
Exceptional drought
Burgundy
Water emergencies; extreme agricultural losses; widespread impact.