
Weather Maps
Updated weather information for the continental United States.
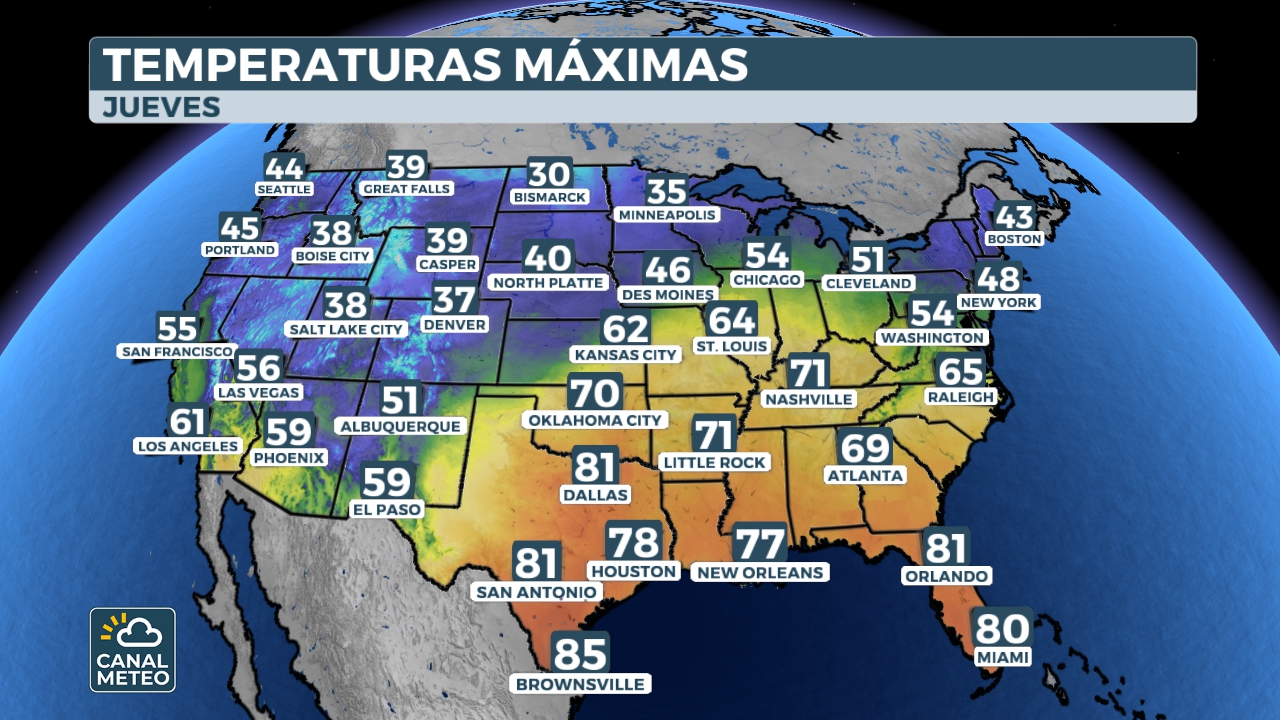
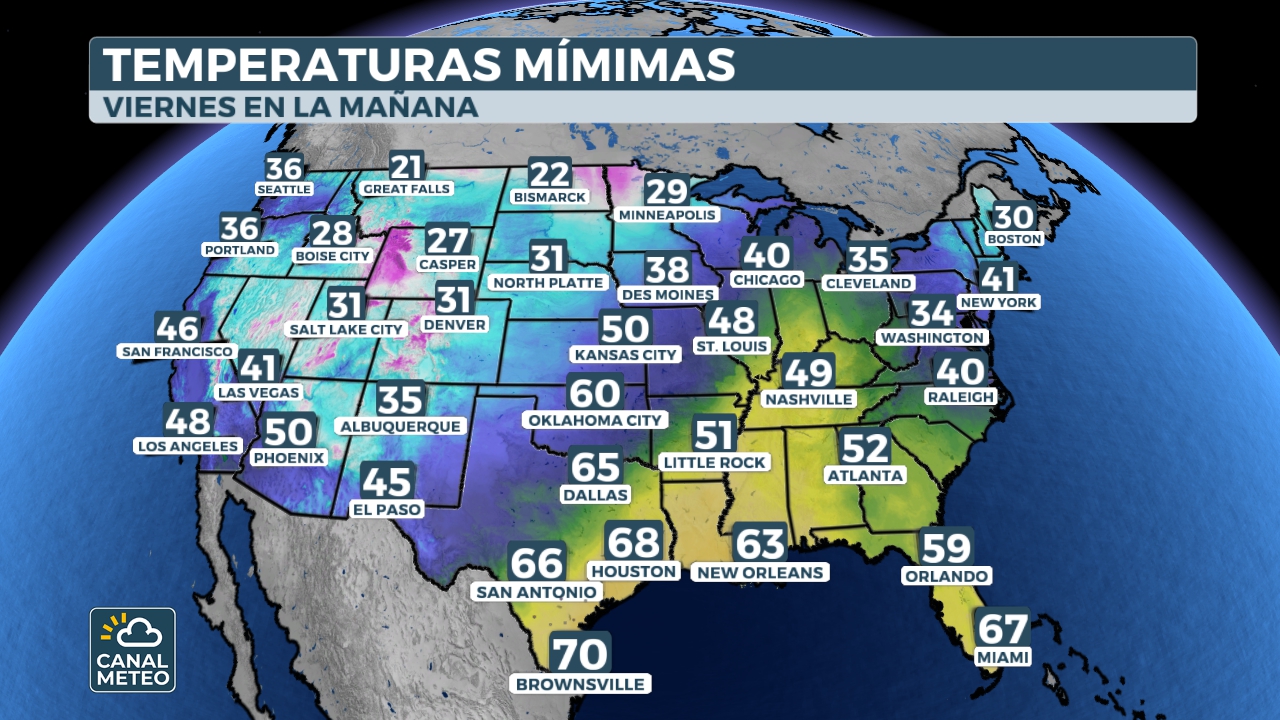
🌡️ Today's Temperatures
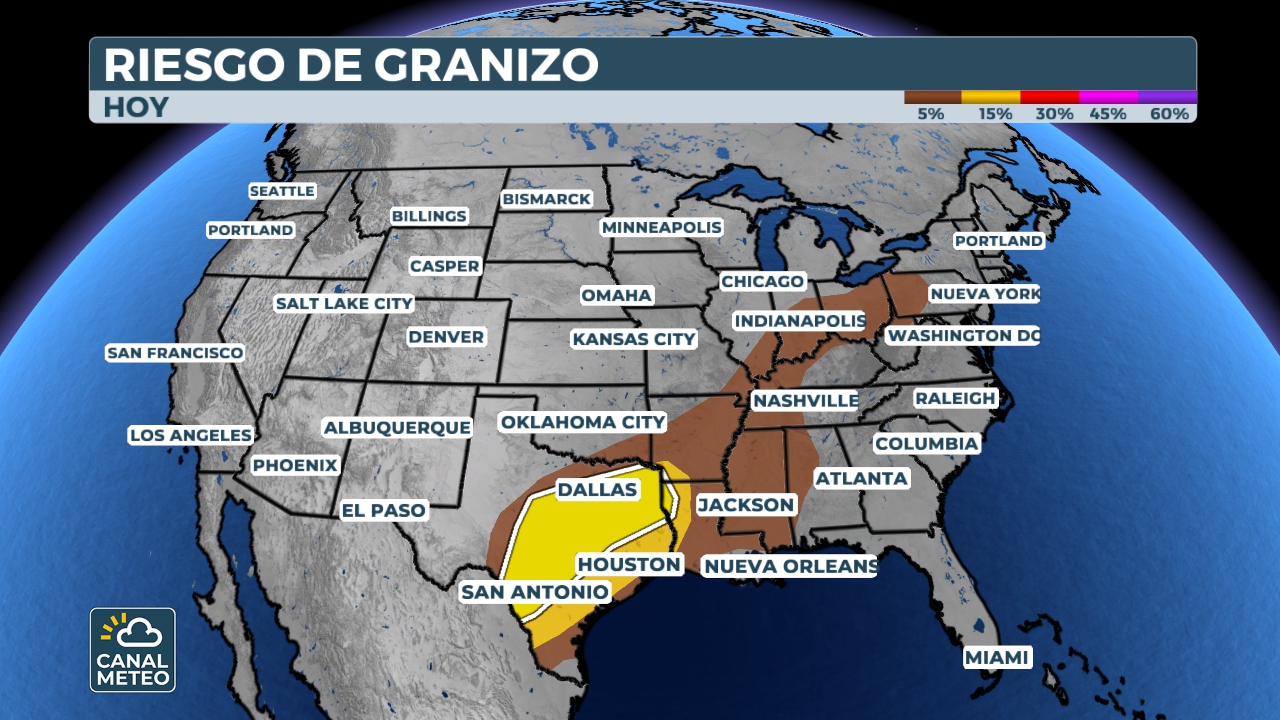
⛈️ Severe Weather Risk (Day 1)
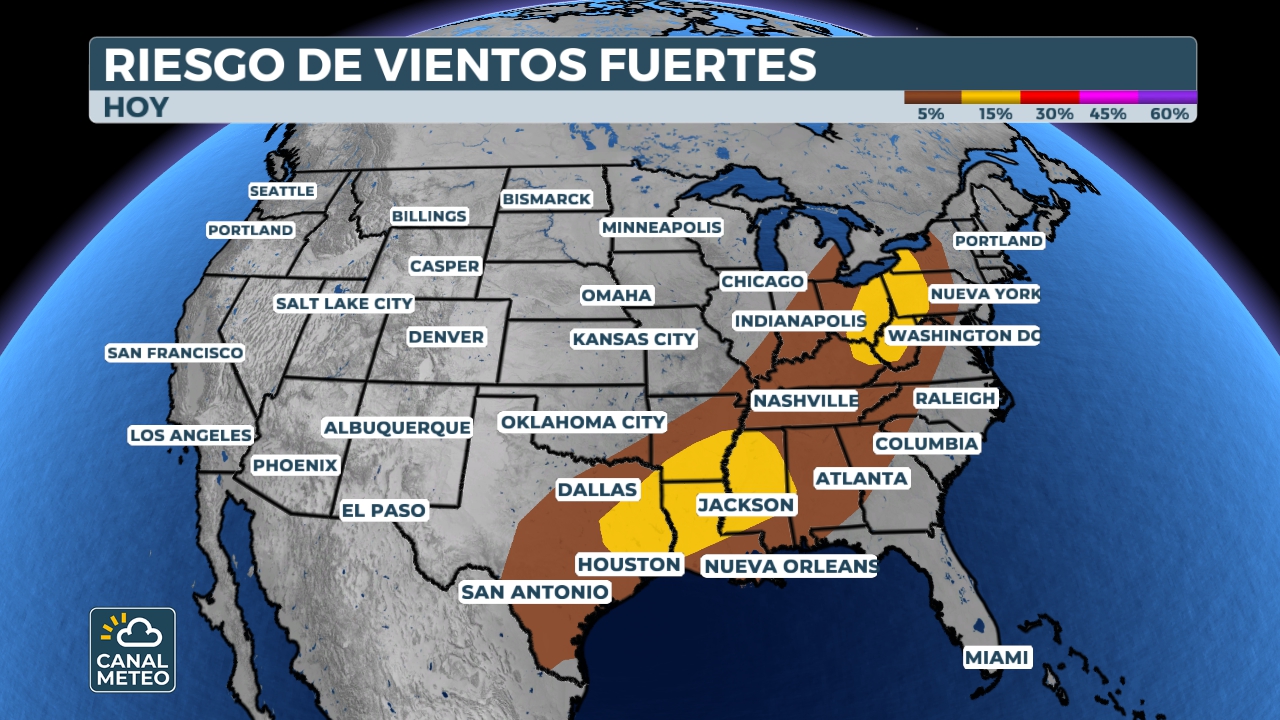
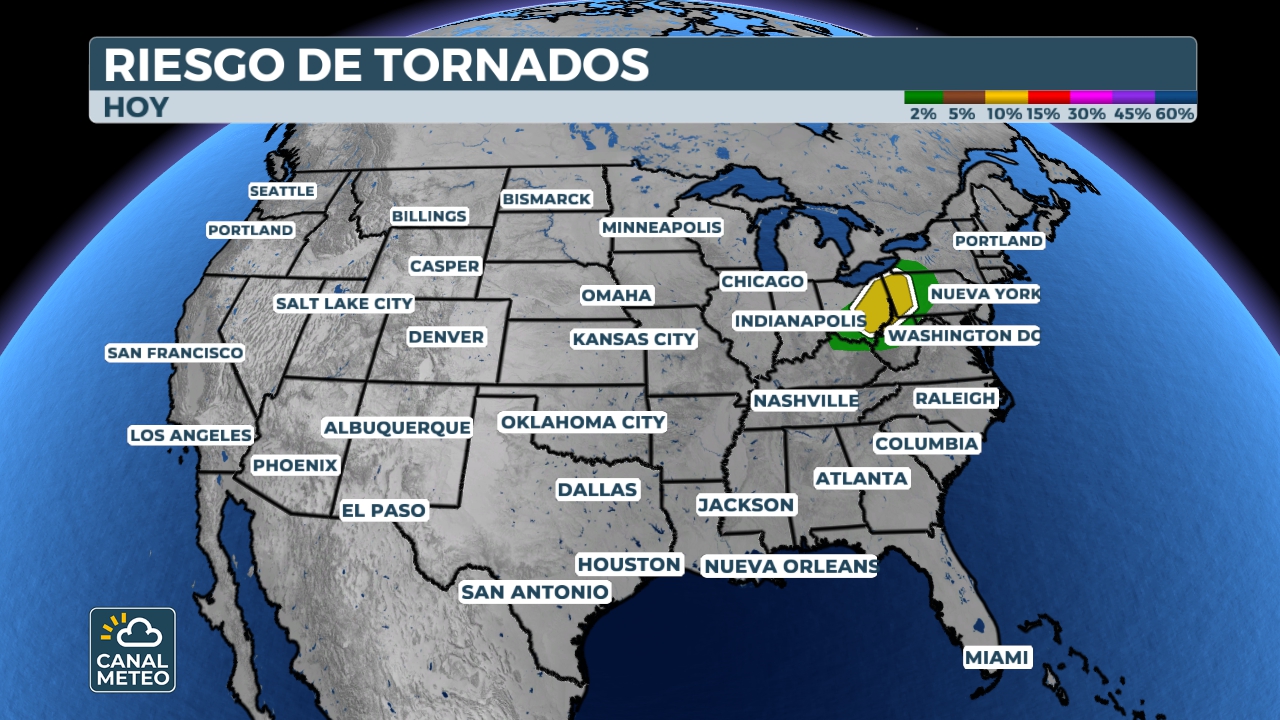
SPC Risk Levels
The Storm Prediction Center (SPC) classifies severe weather risk into five levels based on the probability and intensity of phenomena such as tornadoes, hail, or strong winds.
| Level | Name | Meaning |
|---|---|---|
| 1 | Marginal | Isolated storms |
| 2 | Slight | Hail or strong winds possible |
| 3 | Enhanced | Organized storms |
| 4 | Moderate | Strong tornadoes possible |
| 5 | High | Significant severe event |
🛫 Airport Delays
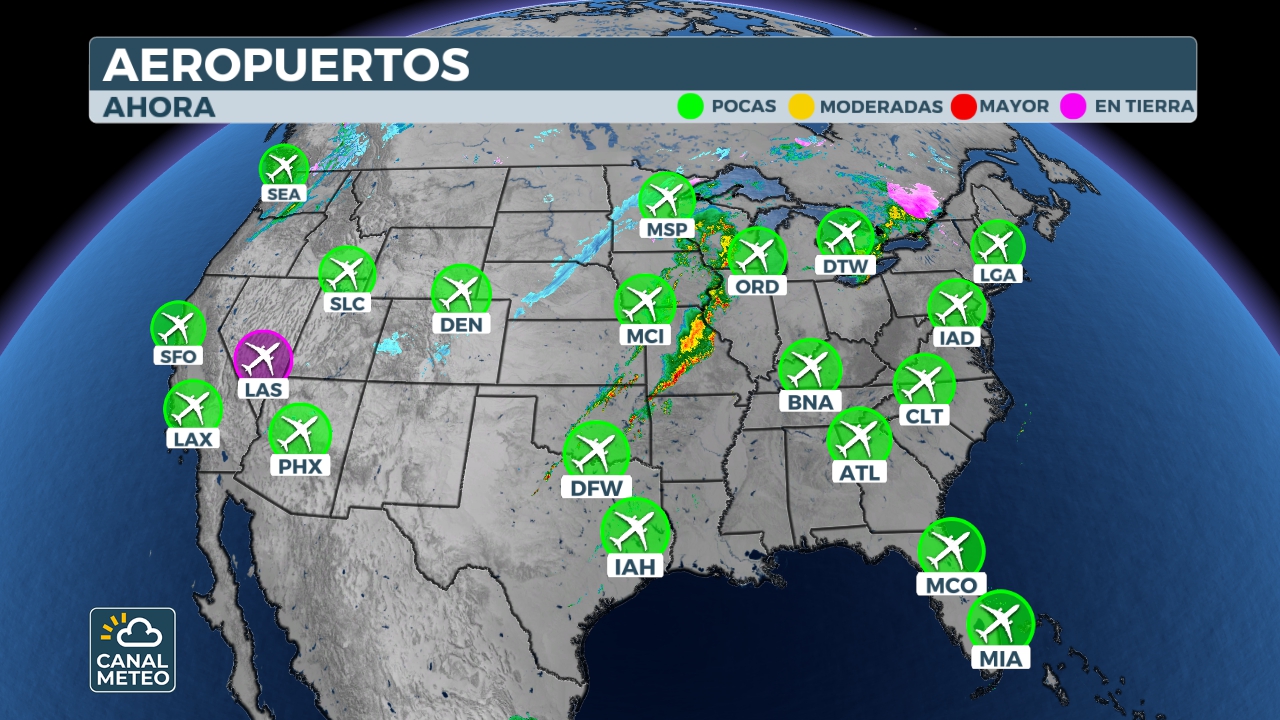
Airports with Most Delays
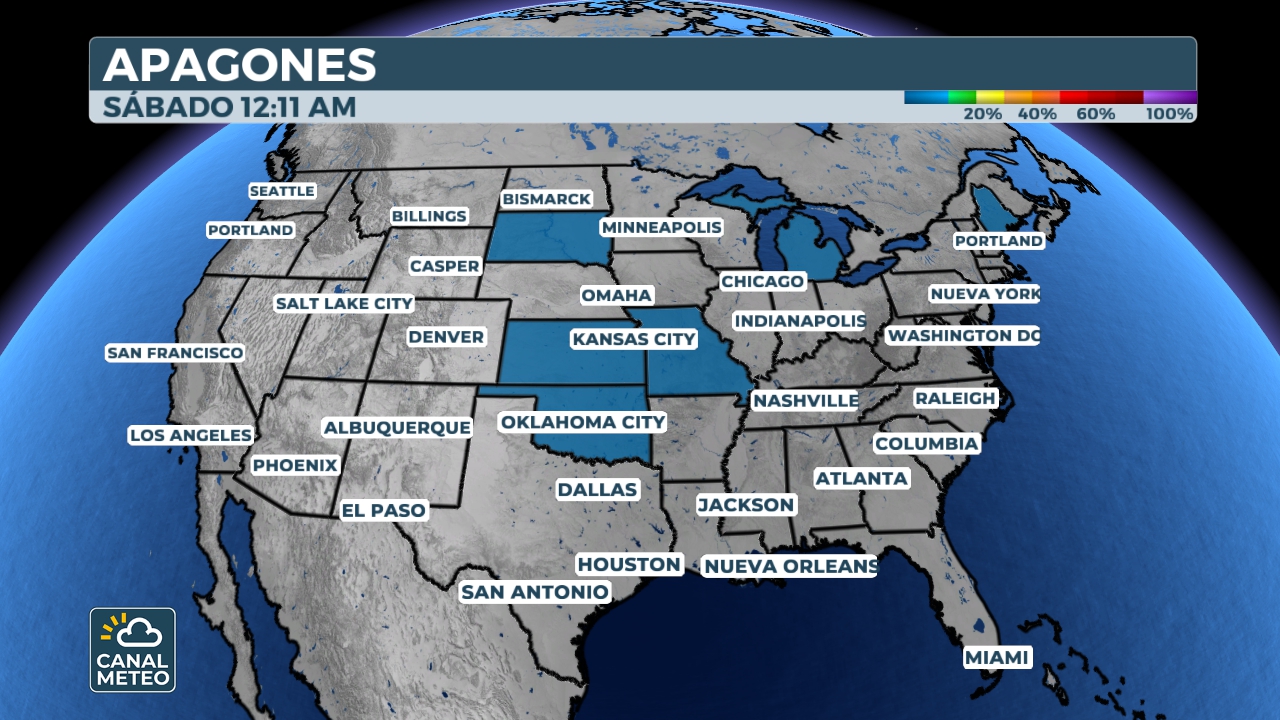
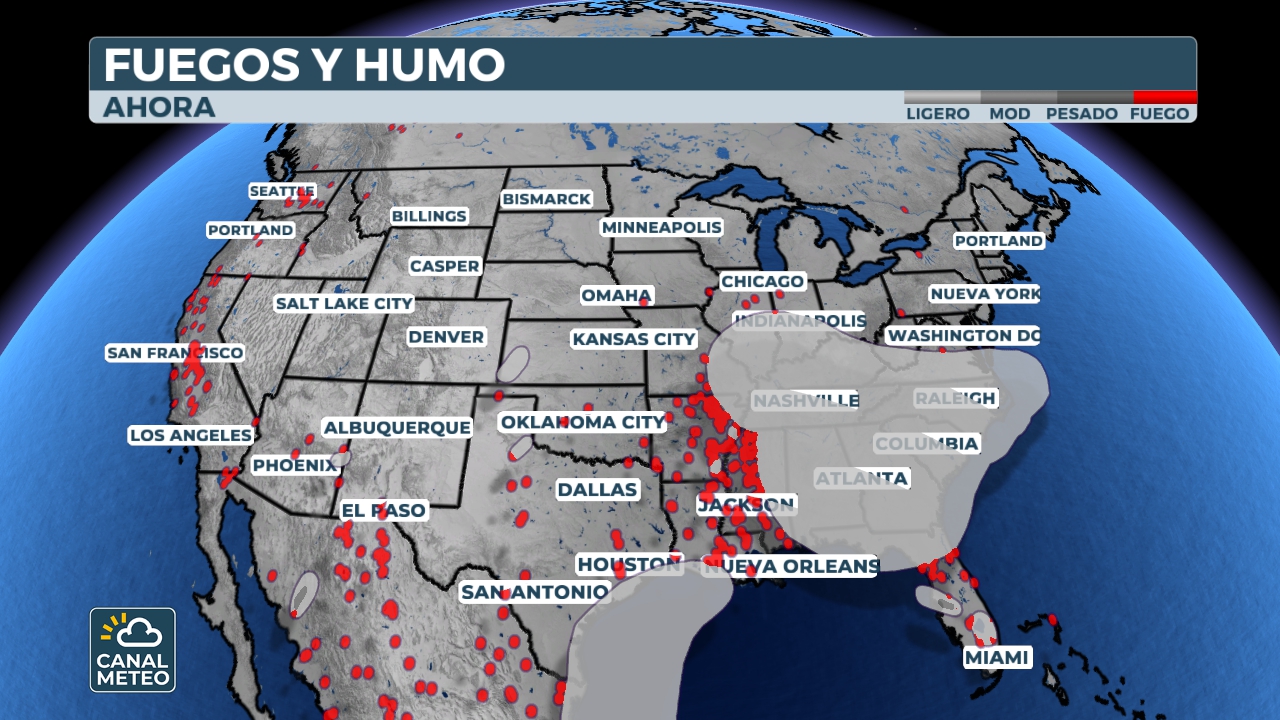
⚡ Power Outages & Fires
📅 6-10 Day Outlook
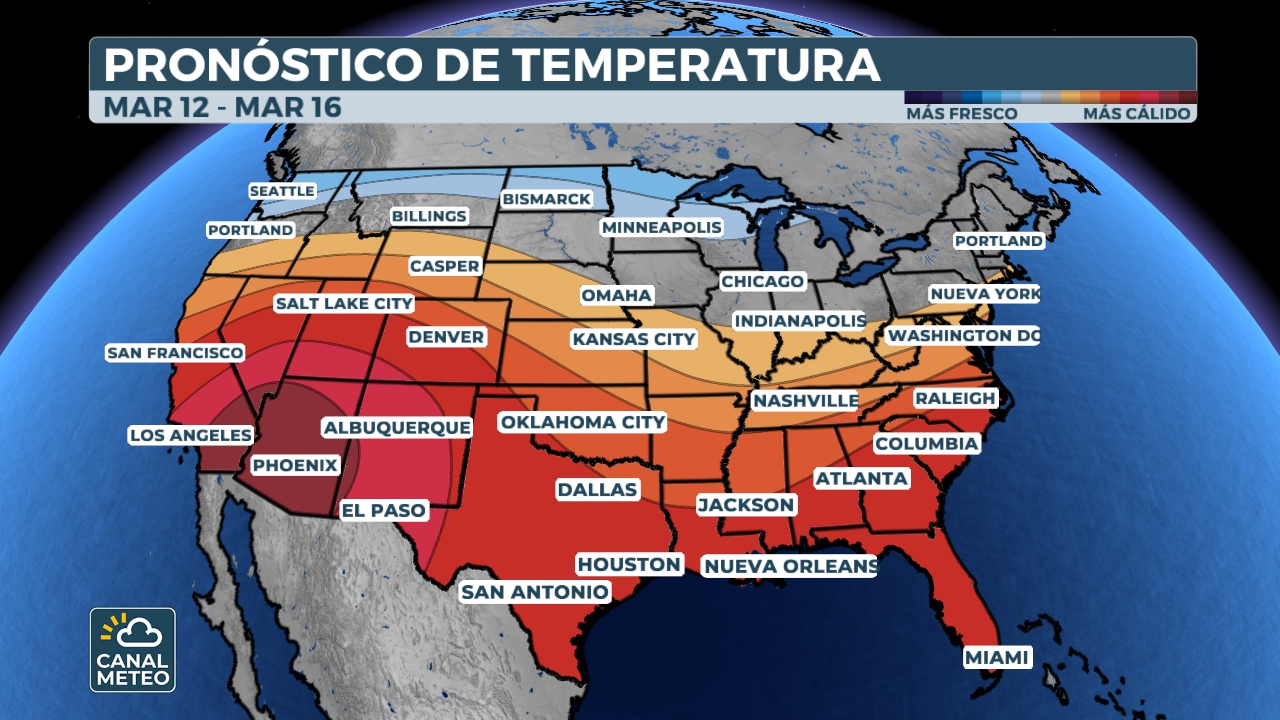
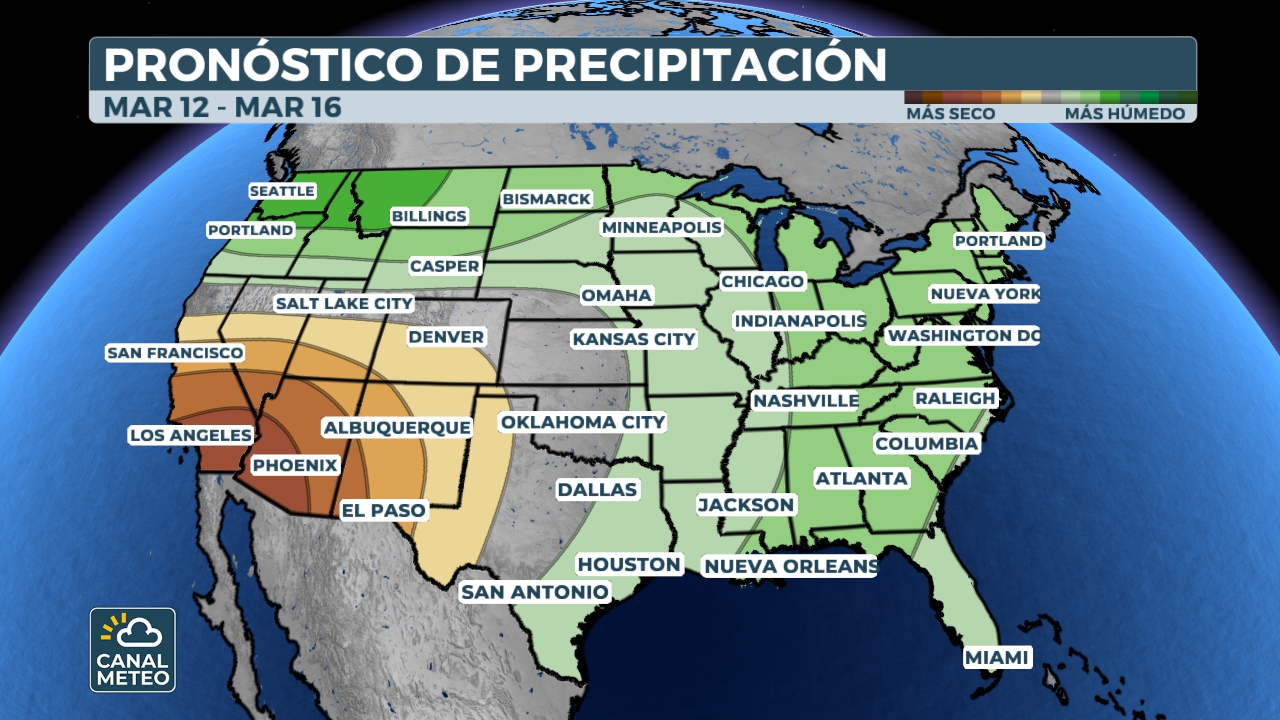
Climate Prediction Center (CPC)
NOAA's Climate Prediction Center (CPC) provides long-range forecasts showing the probability of temperatures and precipitation above or below normal. Warm colors indicate probability of above-average temperatures/precipitation, while cool colors indicate below-average.
More info at CPC🌀 Tropical Activity (7 Days)
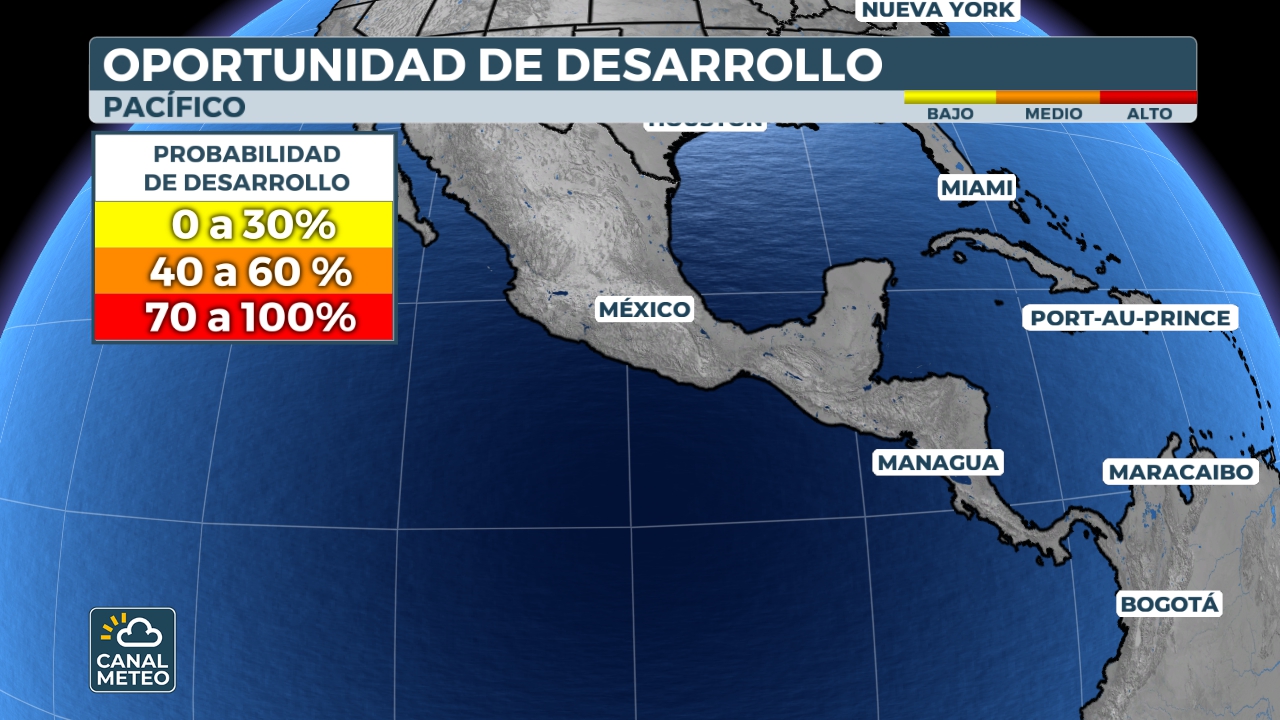
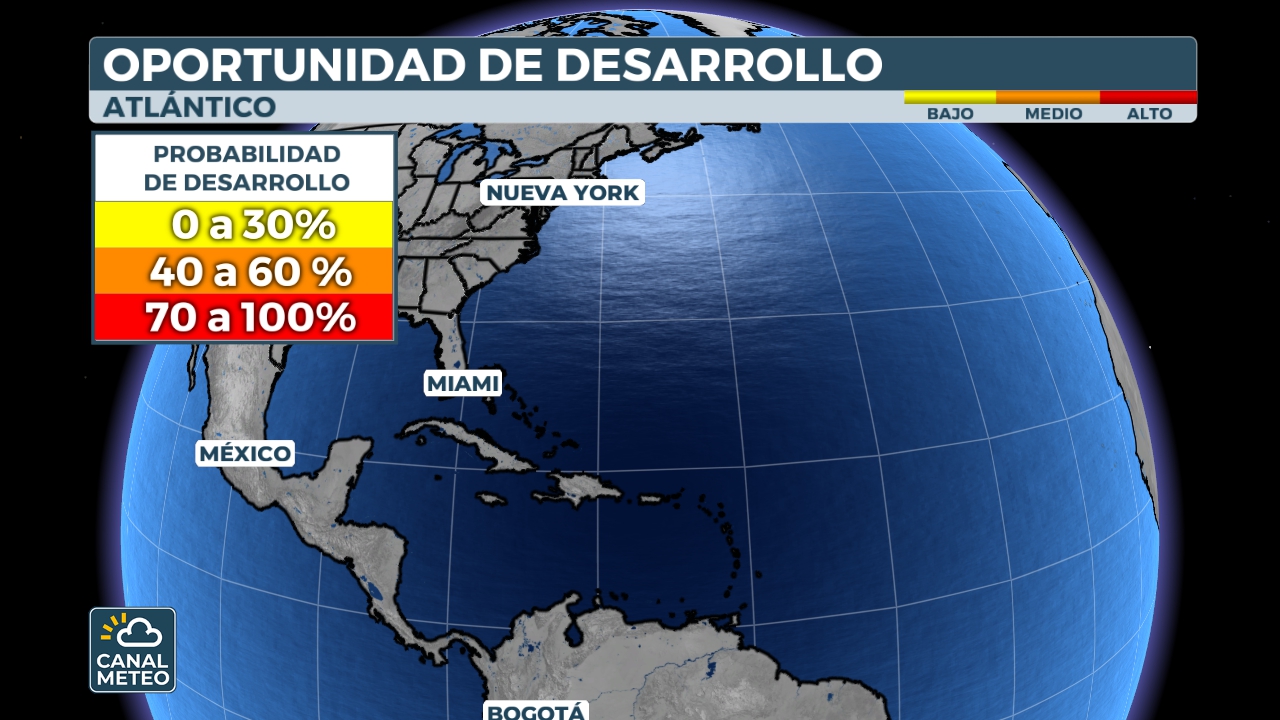
National Hurricane Center (NHC)
The National Hurricane Center (NHC) monitors tropical activity in the Atlantic and Eastern Pacific. Maps show areas with potential for cyclone development over the next 7 days. Colors indicate probability: yellow (low), orange (medium), and red (high).
More info at NHC